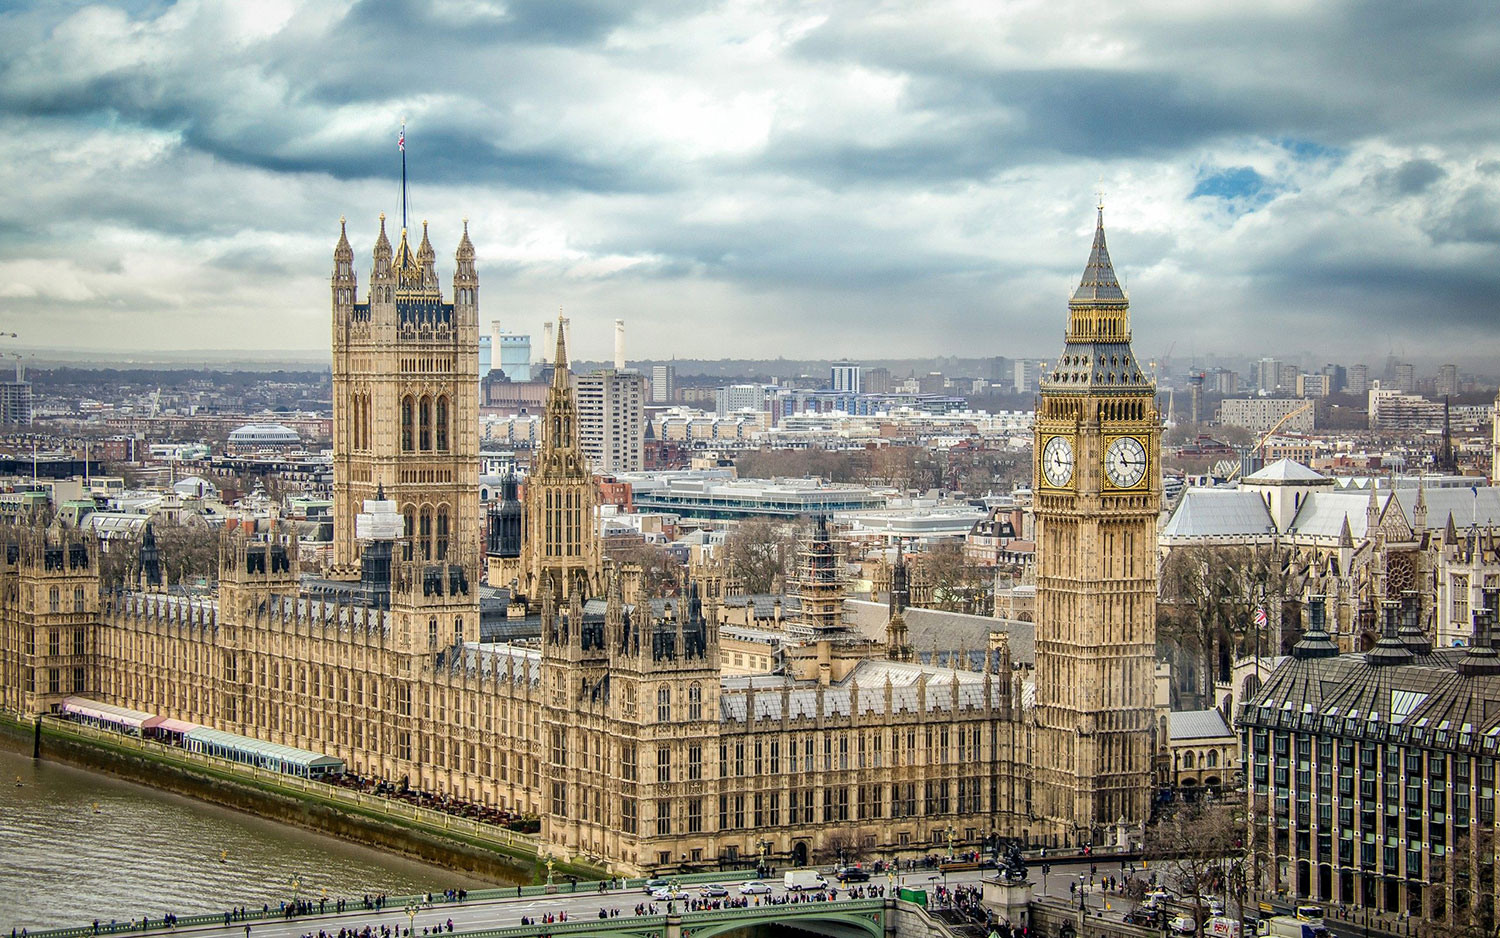
London Guidance for Immigrants

Let's Go

Happiness

According to citizens' happiness index survey in the UK in 2013, people in North Yorkshire have the highest happiness score, compared to the lowest happiness score in East London. The indicators of the happiness index mainly include the safety of citizens’ living area, the closeness between residents and the living environment.


Population Compositions

From 2016 to 2026, the population growth rate in London has reached 12%. This mainly depends on two main reasons. With the improvement of medical standards, the birth rate of the population has gradually increased, while the death rate has gradually decreased. In addition, the number of net immigrants in London city has also continued to rise.


Education

As a globally diverse city, students from more than 200 different countries come to London to study every year. With top teaching resources, high-quality teachers, and open teaching environments, London has attracted students from all over the world to study here. This also makes the education level of London citizens increase year by year.


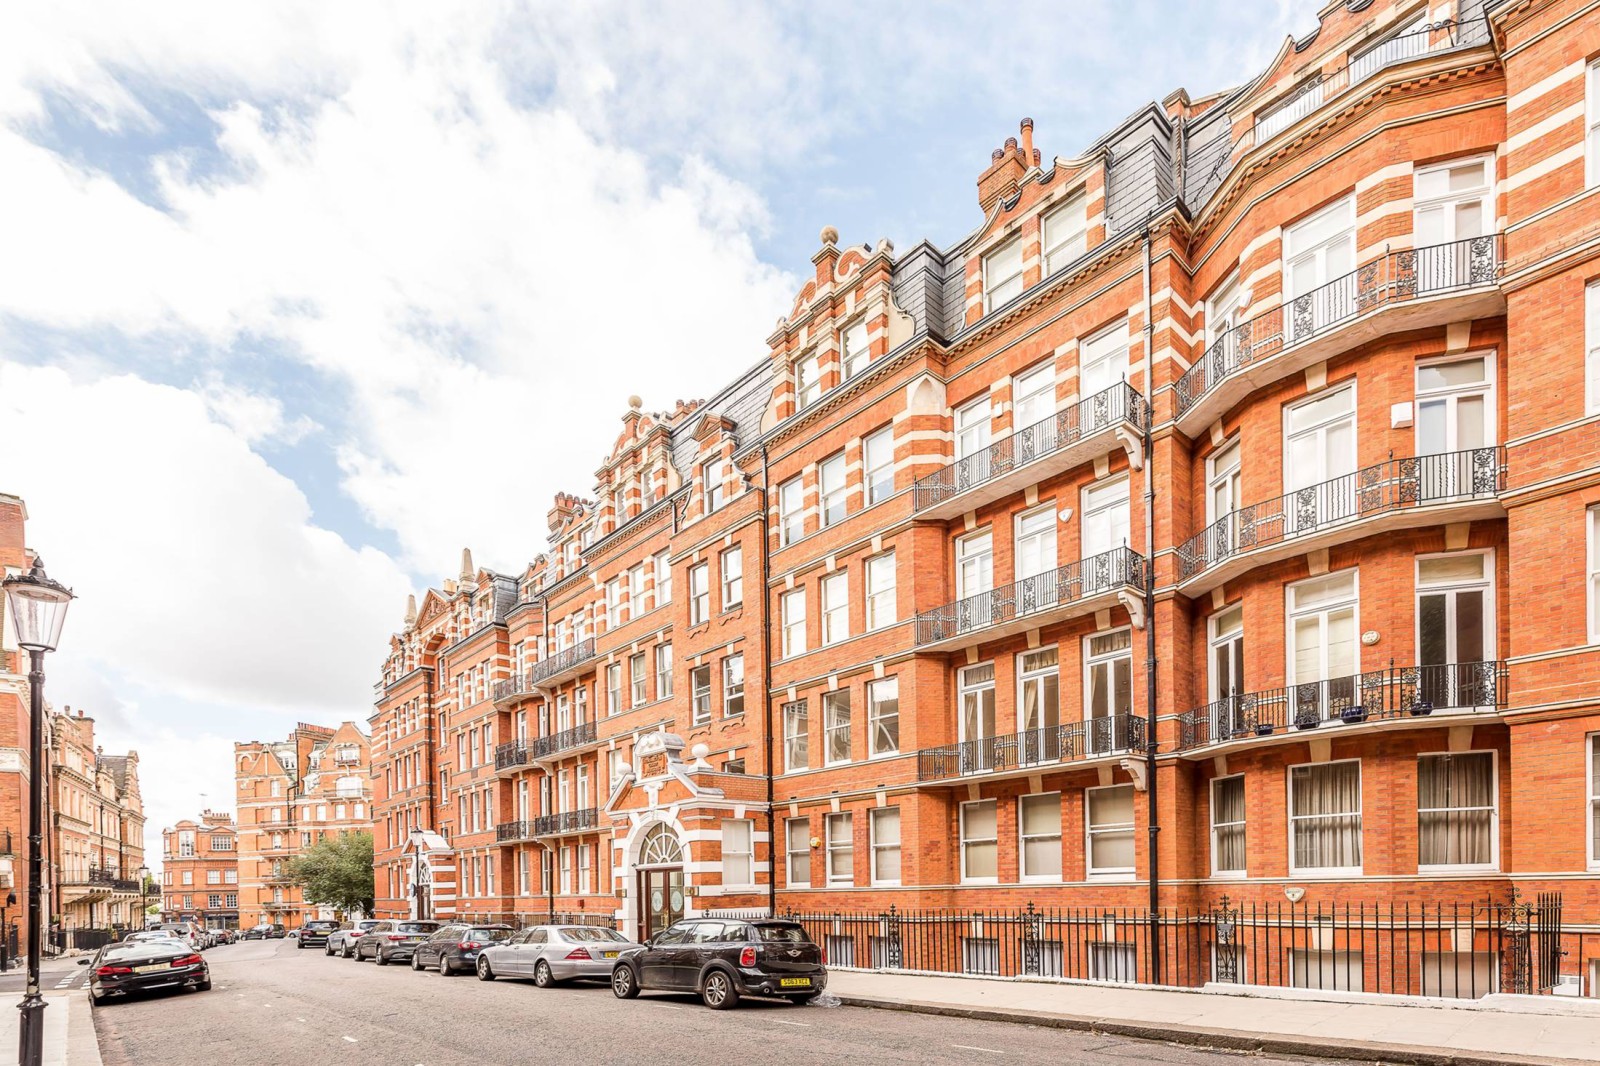
House Prices & Crimes

Statistics show that the average house price in the UK has risen by 41% between 2010 and 2020. The London area shows the largest increase in house prices, reaching 62%. In London, the boroughs with the highest price are the Waltham Forest. When people choose their place of residence, one of the most concerned factors is the crime rate in this area.
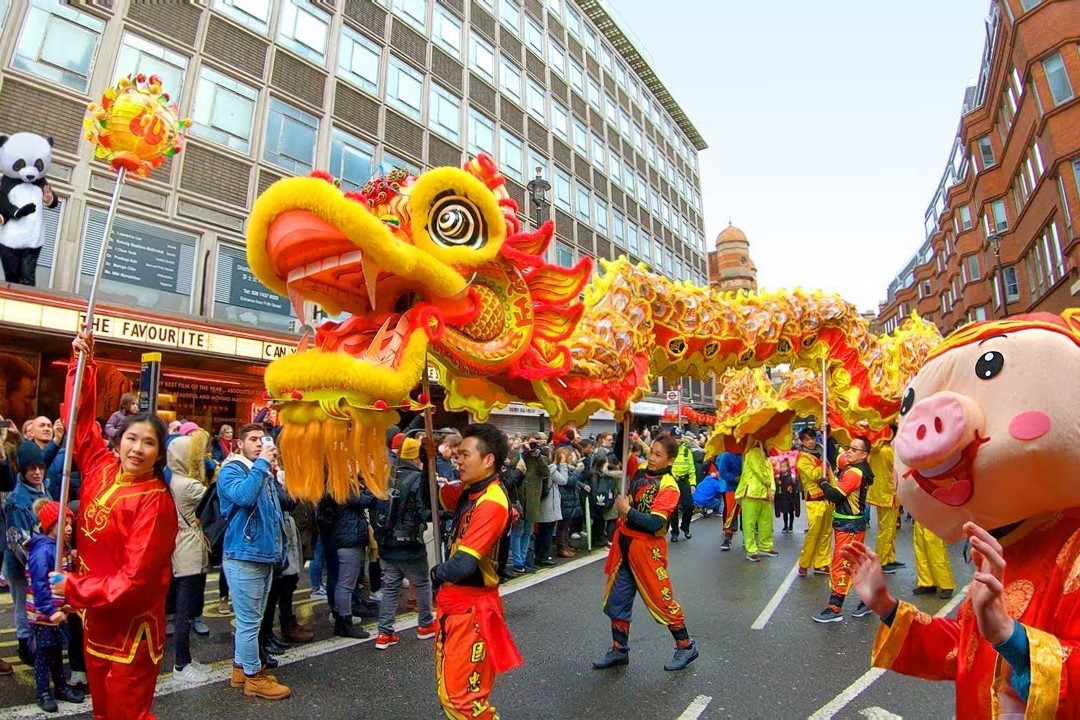
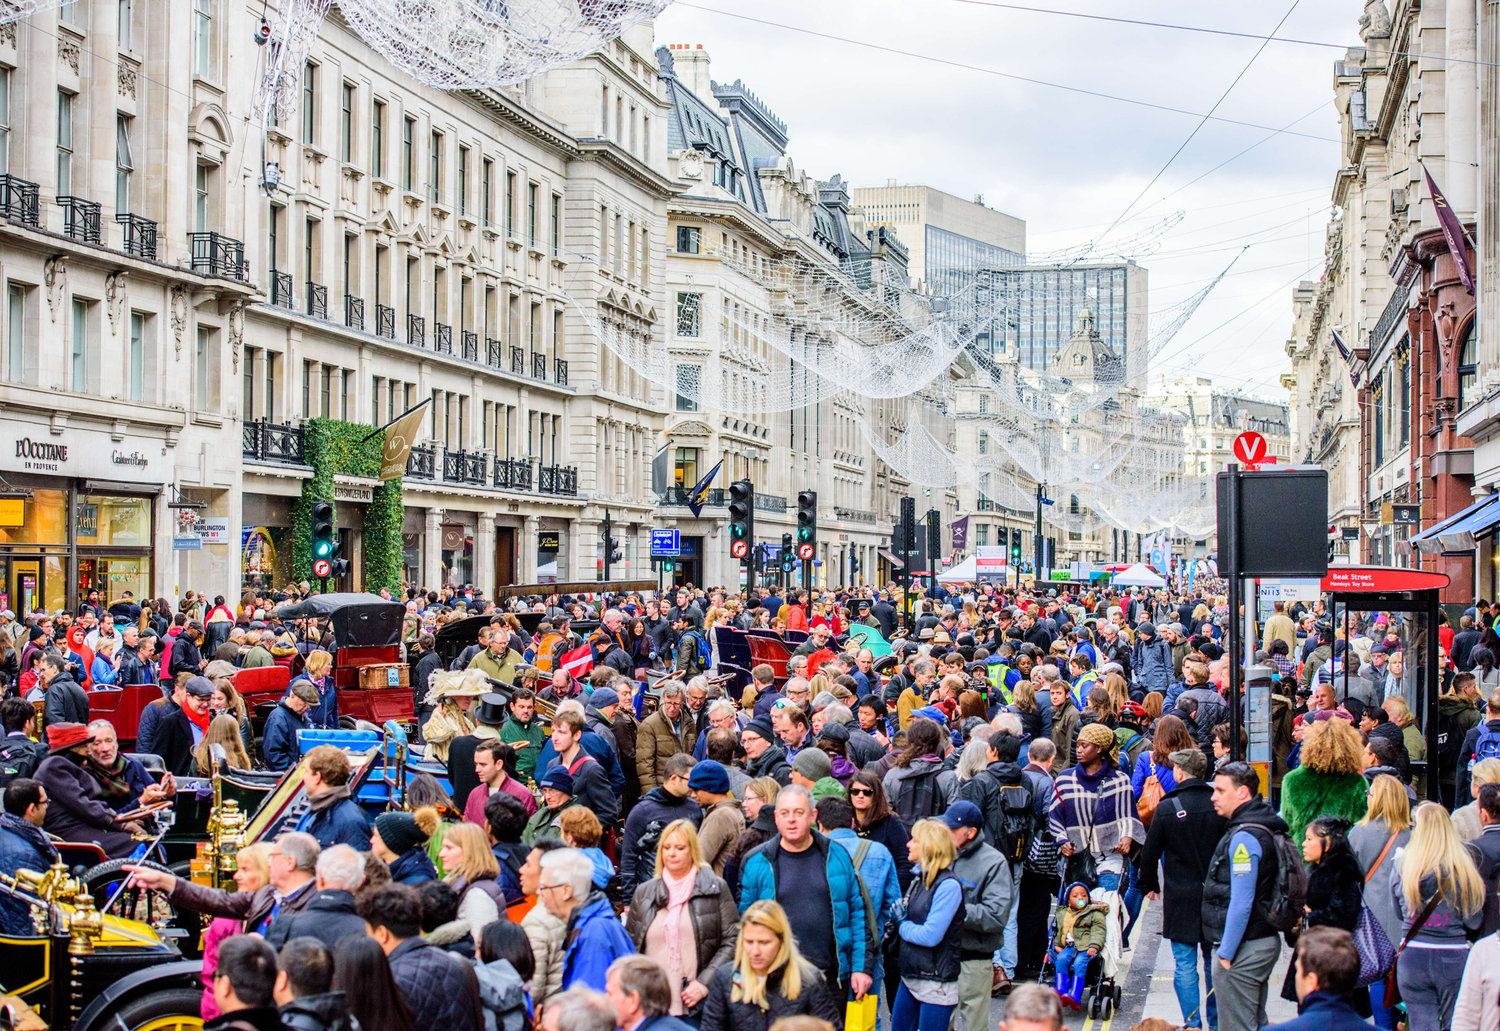

Annual Events

There are tens thousands of events held in London every year. What a Vibrant city! In this section we select some famous events which are held almost every year, some are indoor some are outdoors. These events kinds of like ‘things you must do in London’, they are really special, attractive events. Some tradition can back to hundreds of years.


Happiness

Are you ready to explore your life in London?


Let's kick off with happiness!    Go Go Go ...

Population compositions

Are you curious about population compositions in London?

We can clearly see that the population density of outer London has not increased as significant as the inner London, also most of the flow of people has gathered into inner London. The density of Camden and Southwark has increased the most in the past decade. London is dominated by adults. Elder people are mostly based in outer London, except for two boroughs with highest incomes (City of London, Kensington and Chelsea). Children under 18 are quite evenly distributed in the city. London is the city which mainly occupied by white races. The white races in the west of London are more densely distributed, and further to east London you can see the distribution of the various races is getting more and more even. So, Do You Have A Basic Understanding of London Now?

Education

How about the education situation in London?

The results show that the average percentage of people with no qualifications is 17.6%. The ward with the highest rate of people with no qualifications is Havering - Heaton. 35.8% of people in this area have no qualifications. In contrast, only 3.8% of people with no qualifications live in the Kensington and Chelsea-Courtfield ward. Furthermore, the average percentage of people with level4+ qualifications is 37.7%. The Wandsworth-Northcote ward has the highest rate of people with Level 4 qualifications and above (68.7%). However, only 12.5% of people living in the Croydon - Fieldway ward have Level4+ qualifications.

Regarding the A-level average point scores per student, the average score in the London area is 691.9. The Richmond upon Thames - East Sheen ward has the highest scores, which is 879.7. Nevertheless, the score in the Croydon - Fieldway ward is only 509.6, which is the lowest among all wards in the London area. Turning to the average GCSE score per student, the average score in the London area is 327. The highest score is 396, which is achieved in the Barnet - Garden Suburb ward. In contrast, the Croydon - Fieldway has the lowest score, which is 276.

House Prices & Crime Numbers

I guess you want to know how to choose your residential address!

House prices and surrounding security conditions are considered the two important factors when people choose their places of residence. At the same time, it is wise to choose your residence according to your work or study place. Let’s start to explore the distribution of house prices and crime numbers in London, and you will get more details by clicking a certain area on the following map. The button 'Reset charts' can help you return to the overall information and the distribution of house prices in different year can also be seen by moving the slider bar.

Annual Events

Are you interested in annual events in London?

As a vibrant country, there are more than tens of thousands of leisure activities and events held in London each year. As an inclusive city, these events are held for and welcome everyone, some of them are traditional British activities last for hundreds of years, some are modern events support for different minority groups. 

So, have you decided where to live?
Hope you have a wonderful life here!

London Guidance for Immigrants

Creators: Wei-Chu Wen, Zuorui Shen, Yuhao Liu, Nan Yang

Group 4